The debate between whether one should use technical indicators or resort to fundamental analysis of the company in arriving at the decision of investing or not investing has a long history. However, sometimes these indicators can work very well - IF USED INTELLIGENTLY.
One of the good indicators that I have come across is the MACD - Or the moving average convergence-Divergence. I don't say that it is the go-to indicator for making your decisions - but what I like about it is -
1. The signals it gives are more reliable then others.
2. The signals - beyond the crossovers - are often leading indicators and can enable you to buy the security/sell it at its lowest/highest.
Let us take an example to make my point clear. I am not trying to focus too much opn how the indicator is calculated - rather on what it says and how should one interpret it.
I'll take the example of Suzlon - A stock that has rallied tremendously in the past 1 year, Reaching an all time high of Rs. 35 before starting its descent. The question we need to answer is - for someone who bought the stock at, say 25 bucks, could have predict the down-turn at 35 and sold at that point.
The price history of the stock is shown below -

We can clearly see the surge in prices in a matter of a few months. An investor, looking at the stock in Jan-Feb would have been able to buy the stock at Rs. 10. Now let us look at the MACD overlayed on this.
What is a cross-over -
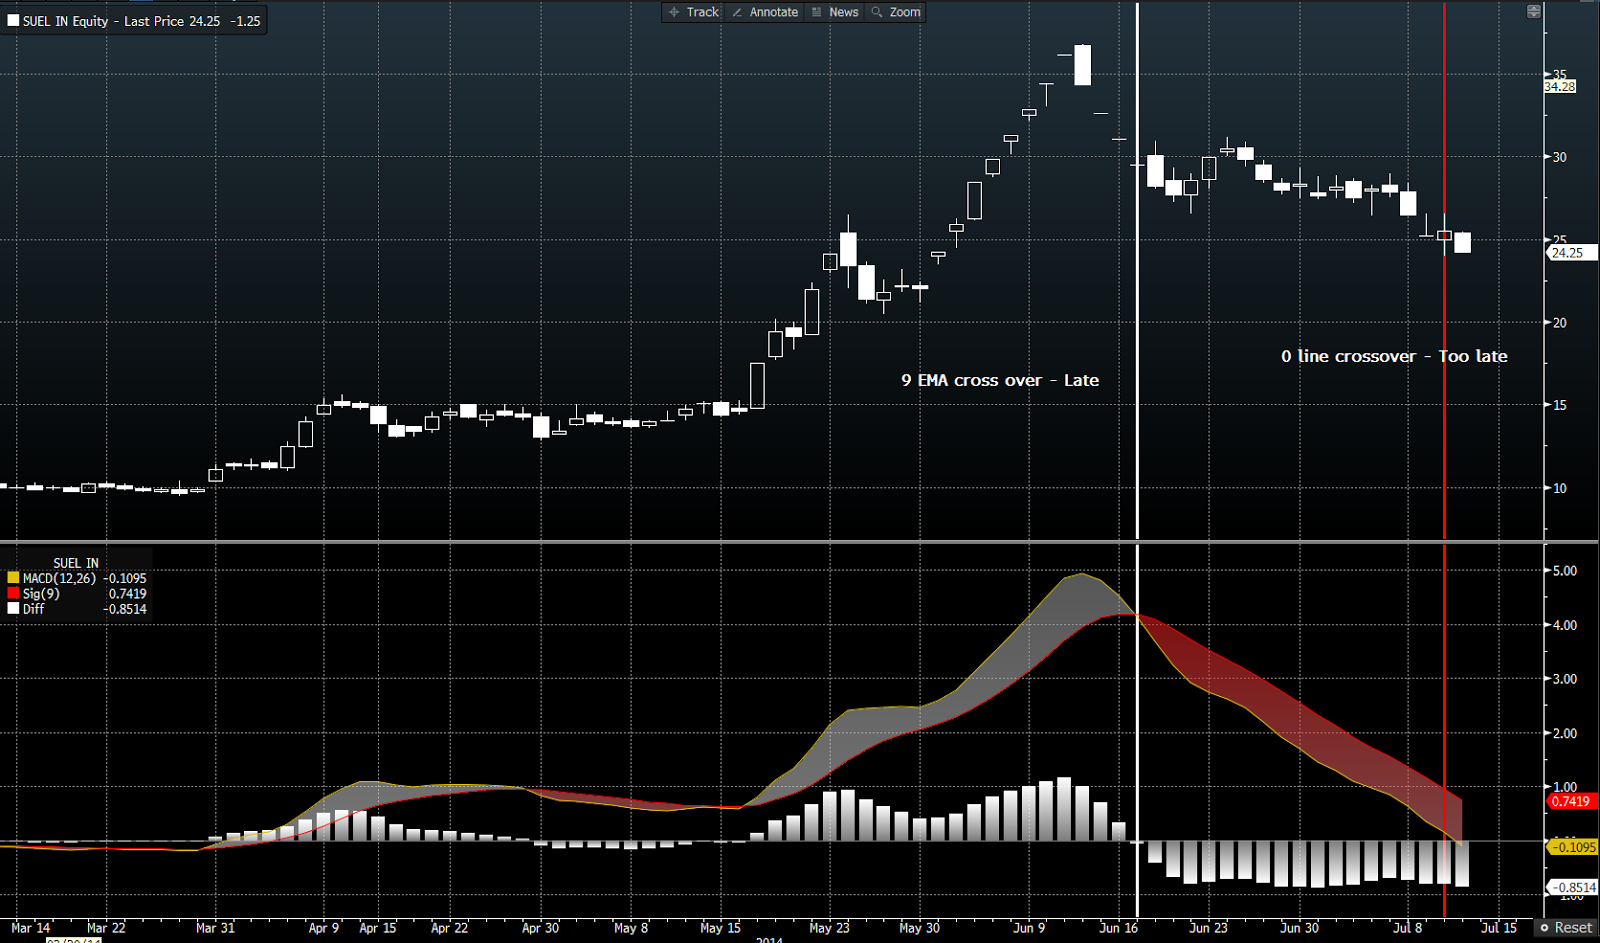
The MACD is a simple difference of a 12 day and 26 day Moving average. A negative value (below the neutral line) means that the selling activity is present and the prices are going down at a faster rate. A sell signal. However, if you were to rely on this, you would have sold the stock at 24.5 Rs. -Almost 10 busks below its peak. Not so good then.
The signal line cross over does a much better job as it measures the MACD relative to its own 9 day Moving average. MACD line below the 9 day EMA (White line in the graph) is again a sell signal. However, based on that signal, the value would still have been about 5.5 Rs below the peak. Can we do better?
Let us now also consider the histogram. What it tells us is simply the gap between the MACD and its 9 day moving average. What does that signify? Rising bars in the histogram means that the MACD is moving faster than its average (upwards) and is a strong buy signal.
Once you see a rising MACD and a falling histogram - it means that the 9 Day EMA is catching up and sooner or later there will be a reversal. I have highlighted the this in the next diagram.
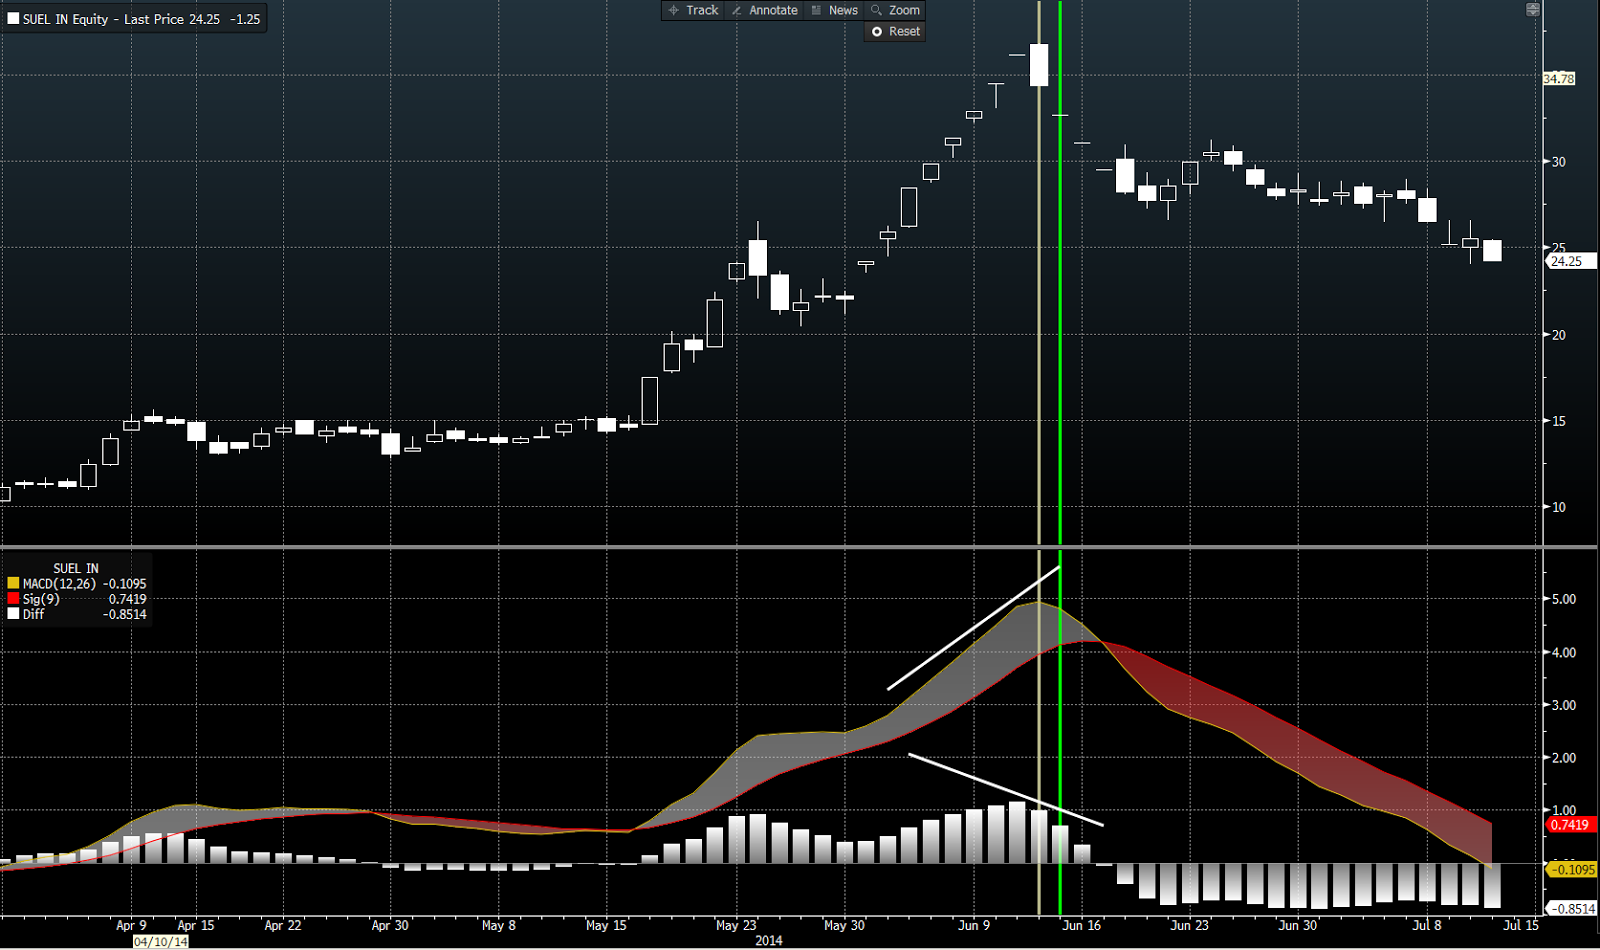
This time if your are vigilant, you could have sold it for around 32-33 Rs. An improvement of almost 3 Rs./Share. Of course one could combine this with another great indicator like RSI. The overheating is clearly seen before it reaches its peak telling us that it is over-brought. It is actually hard to miss this one! Most of the guys would hve realized this down-trend by the time it touched 32-33. But that is not the case!
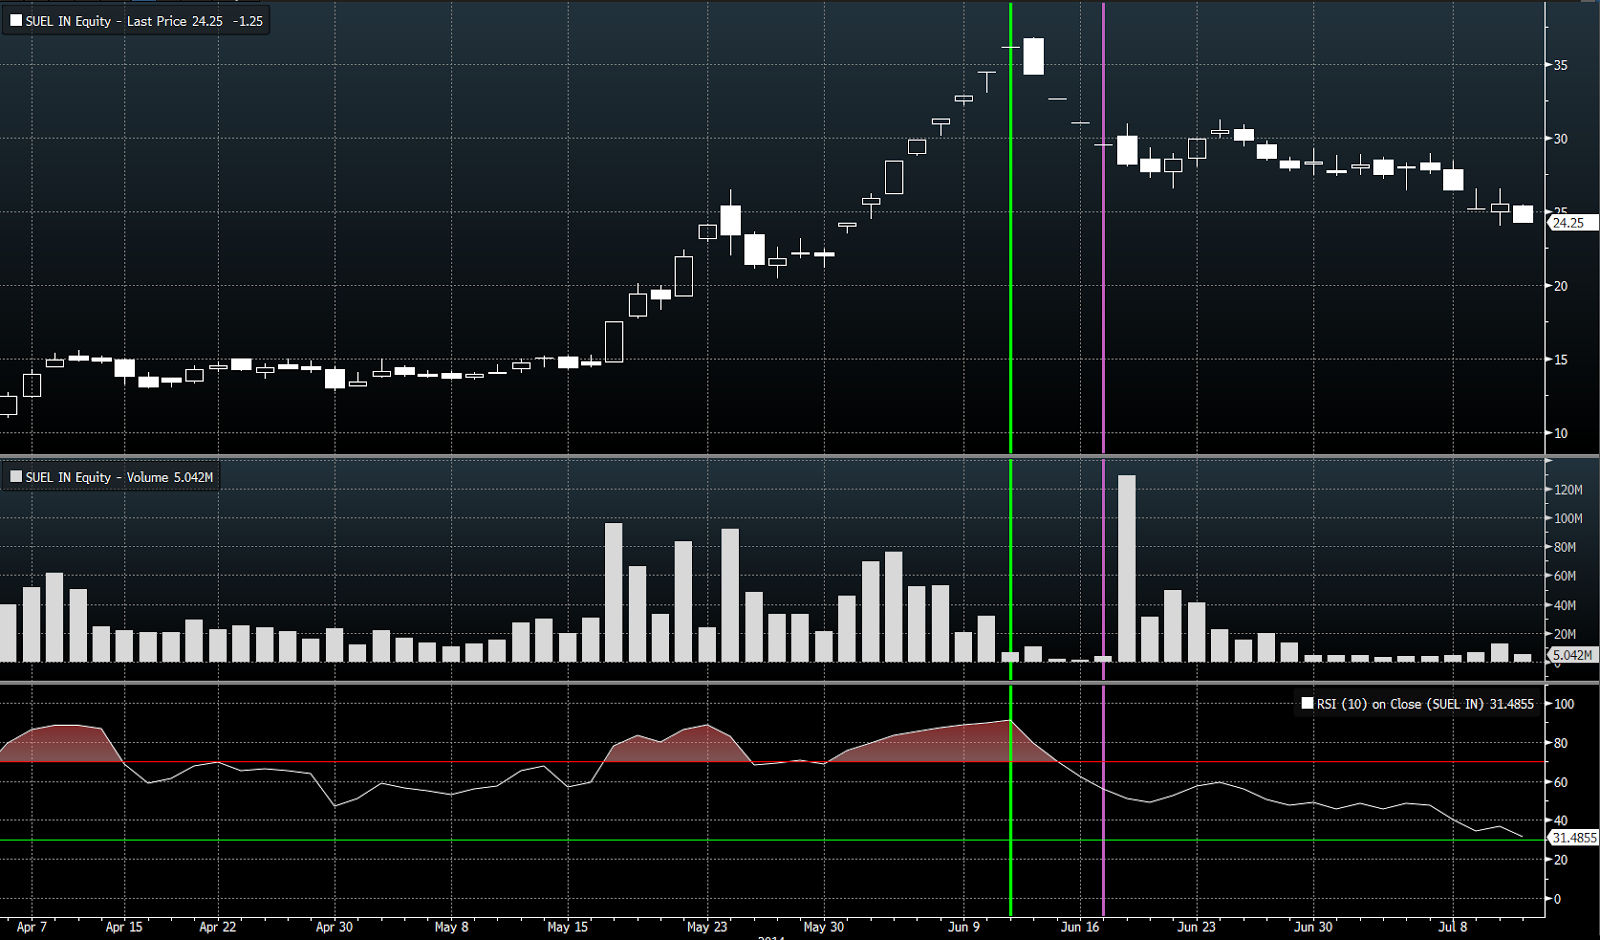
The trading volume actually did not pick up until the value fell to Rs. 30. People were waiting with baited breathe - seen in the abysmally low volumes near the peak - meaning that they would have been continuously monitoring the stock. Had they used MACD - They would have done better! :)
Kidding aside - Some people have this notion that technical indicators are never reliable. However, if you base stuff on solid math they can assist you if not govern your decision making.
Cheers
The question is can we apply the similar indicators to other stocks as well? Perhaps, investment would have been an easy stuff then!
ReplyDeleteThat is correct. IWe cannot. If you are into this business then you might use multiple indicators. This kind of signal is rare but MACD can be very powerful in predicting the reversal.
ReplyDelete